ETOOBUSY 🚀 minimal blogging for the impatient
Mininet topology visualization with Graphviz
TL;DR
Visualizing the topology of a mininet setup, using Graphviz.
One interesting thing in mininet is the ability to create complex topologies, as we already saw in previous post Mininet polygon topology.
But… we should also have some way to visualize them, shouldn’t we?
Graphviz can support us in this case, with a little help from Perl:
#!/usr/bin/env perl
use 5.024;
use warnings;
use experimental qw< postderef signatures >;
no warnings qw< experimental::postderef experimental::signatures >;

say {*STDERR} "paste your data please, then CTRL-D:" if -t;
my @lines = <>;

say 'digraph D {';
for (@lines) {
   my ($A, $B) = m{
      \A
         (.*?)-eth\d+  # first part
         \s* <-> \s*   # "link" indicator
         (.*?)-eth\d+  # second part
   }mxs;
   say "  $A -> $B [arrowhead=none]"
}
say '}'
The script above expects to receive as input the output of command links
in mininet, e.g. something like this:
s1-eth1<->h1-eth0 (OK OK)
s1-eth2<->h2-eth0 (OK OK)
s1-eth3<->h3-eth0 (OK OK)
s1-eth4<->h4-eth0 (OK OK)
root-eth0<->s1-eth5 (OK OK)
The output is a DOT-compatible text; in the example above it is:
digraph D {
  s1 -> h1 [arrowhead=none]
  s1 -> h2 [arrowhead=none]
  s1 -> h3 [arrowhead=none]
  s1 -> h4 [arrowhead=none]
  root -> s1 [arrowhead=none]
}
This can be fed directly into dot to generate an image:
$ perl mn2dot.pl | dot -Tpng -o prova.png
paste your data please, then CTRL-D:
s1-eth1<->h1-eth0 (OK OK)
s1-eth2<->h2-eth0 (OK OK)
s1-eth3<->h3-eth0 (OK OK)
s1-eth4<->h4-eth0 (OK OK)
root-eth0<->s1-eth5 (OK OK)

$ ls -l
total 20
-rw-r--r-- 1 poletti poletti   611 Mar 23 07:25 mn2dot.pl
-rw-r--r-- 1 poletti poletti 12677 Mar 23 07:26 prova.png
Here we have it:
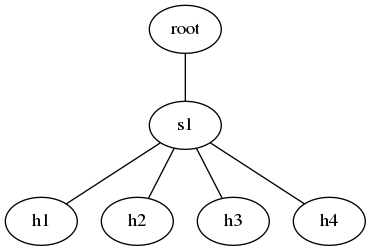
I know, I know… there’s the Perl GraphViz2 module module on CPAN, but maybe for another post!